
Tool Retooling
How do you make a diagnostic tool more insightful?
Challenge
Sales Benchmark Index wanted a more useful tool for prospective and new customers. The self-assessment helped people understand their organization's chance of meeting sales goals and diagnosed how they compared to other companies. The feedback about it said it was too onerous and the results were difficult to understand.
My Role
I led the strategic design and consulting work for this engagement, owning the problem framing, stakeholder interviews, and experience direction from start to finish. Rather than jumping to UI solutions, I started by establishing a clear strategic foundation — developing Jobs To Be Done statements that reframed the tool's purpose for both the business and its customers. That framing drove every subsequent recommendation, from copy to interaction design.
Process
I interviewed the product stakeholder to assess the purpose of the tool for both SBI and its customers. I developed two simple Jobs To Be Done statements:
- For SBI - When a prospect or client is onboarding, SBI needs them to understand SBI's terminology and mindset.
- For customers - When I am working with SBI, I want to know where my business stands and what I need to improve for a great chance of success.
With those JTBD statements, I analyzed the current tool and recommended actionable changes. I also created UI mockups that would help make the tool easier to use.
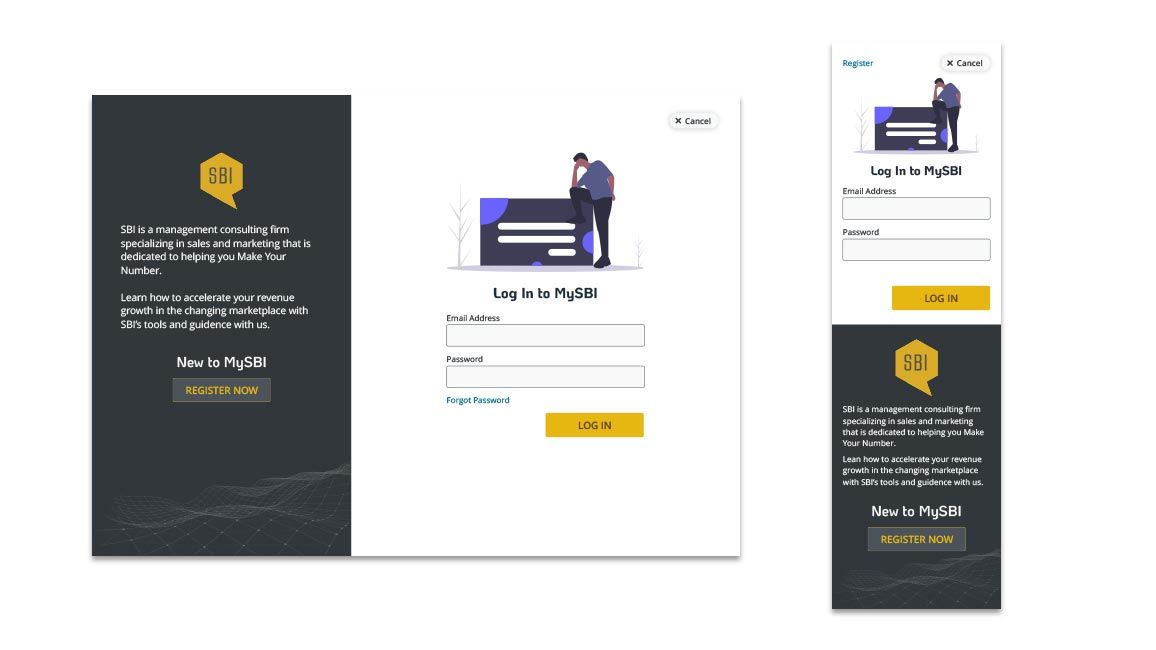
Revised Log In separating the first-time and returning users
Recommendations
- Revise responsive design — make sure the content looks good and is usable on any screen size.
- Revamp copy – shorten the questions and make them easier to understand.
- Question grouping – reduce the feeling of length by grouping questions within each category.
- Simplify results interface - reduce the number of interactions needed to complete the survey.
- Running feedback interface - make sure users can see their progress as they complete the survey.
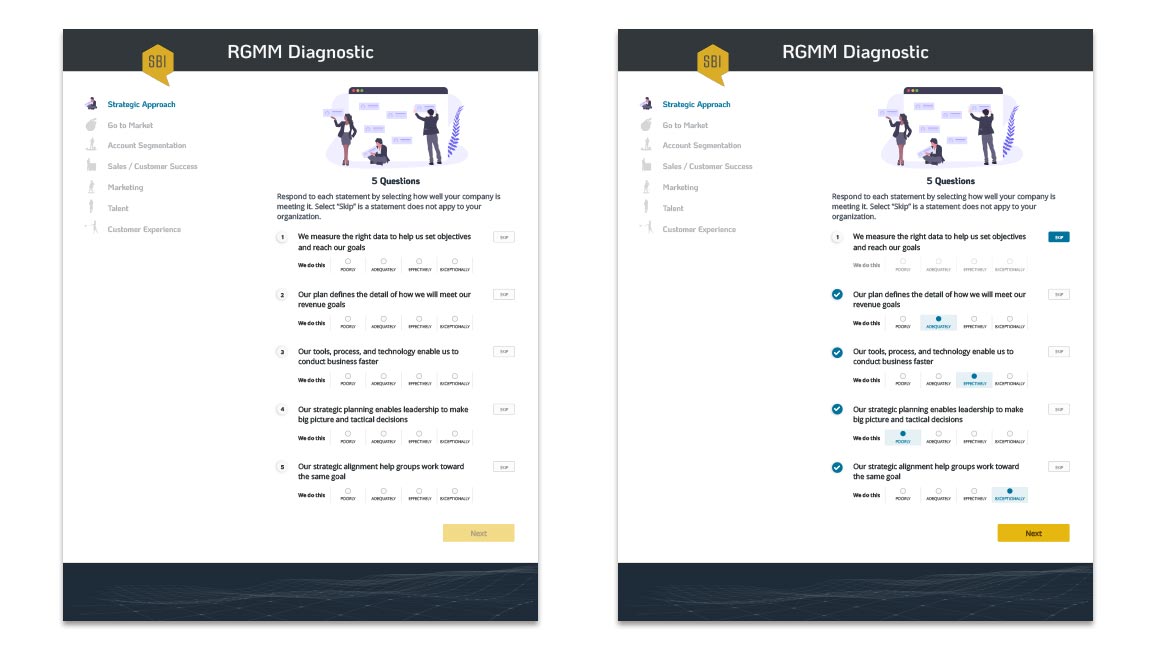
Simplified language and layout to reduce cognitive load.
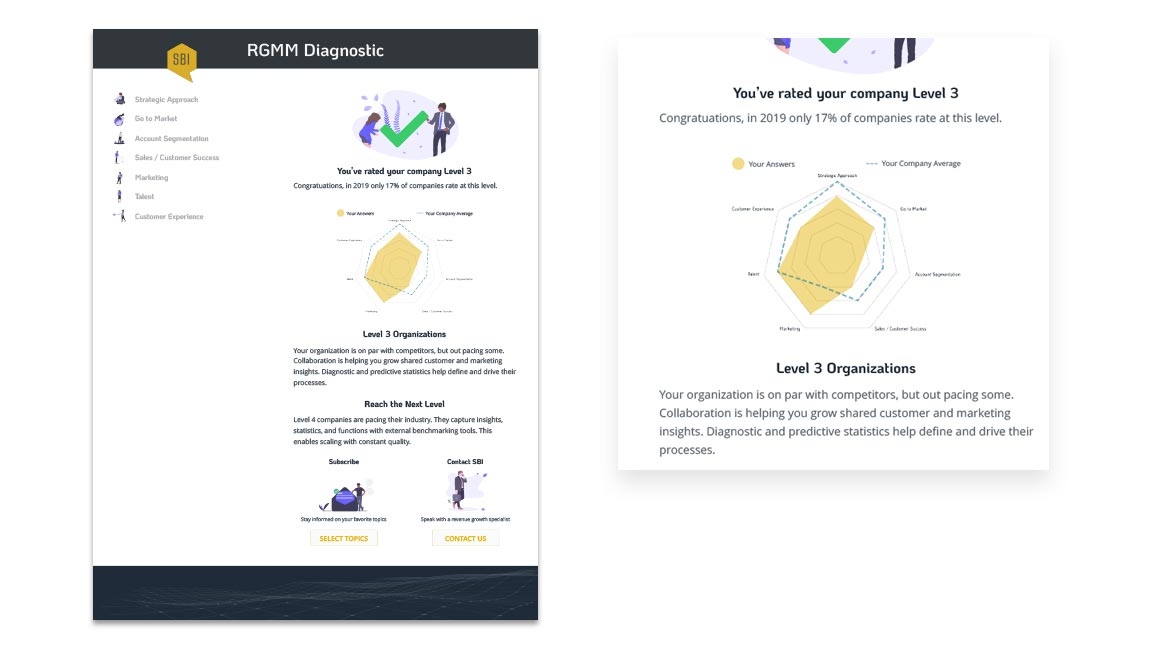
Contextualized results to make it easier to know where to improve.
Results
- Simplified results to reduced extraneous data and focused on the most important parts.
- Provided context to help users understand where their teams align.
- Reduced and narrowed results to increase comprehension.
- Added calls to action for users who want to keep learning.